Forex And Binary Indicator Trading Strategies To Always Be Profit
We can obtain the most accurate and profitable indicators through the results of research and experiments from each indicator, in setting the period and the combination of several indicators into one.
How to trade Binary and Forex for beginners
The initial and easy thing to learn in trading is the indicator. Even though the indicator looks simple, but with the right use it will produce consistent profits.
INDICATOR STRATEGY FOR TRADING
Bollinger Bands are a useful indicator to help measure market volatility and estimate the range of normal price movements.
When price movements exceed normal limits, that's where we use to take trading positions.
Bollinger Bands consist of 3 lines, namely:
- Upper Bands Line (Upper Line)
- Middle Line (Middle Line)
- Lower Bands Line (Bottom Line)
2. Moving Average Indicator
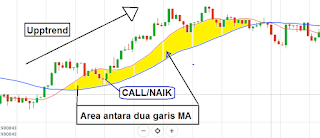
The most accurate and accurate trend indicators that we use in trading are either on iq options or other trusted brokers, one of which is the moving average.
The working method of the Moving Average indicator is to smooth the direction of price movements within a certain time range. So that we will be easier to know the direction of the trend movement that is being or will occur in general, whether the uptrend or downtrend.
Because basically the price of an asset is more likely to be averaged, it can be said that market participants both the buyer and the seller are limited by the average price.
3. Alligator indicator
Alligator indicators are indicators that function to determine the trend that will occur and help analyze how strong the next trend is.
The workings of the Alligator indicator are similar to the behavior of a crocodile. Where a crocodile in hunting always stalks its prey, waiting until the right time to prey.
After eating the crocodile does not immediately hunt again, but falls asleep. Likewise with the behavior in the market movement, which is like a crocodile / alligator.
Alligator has 3 indicator lines, namely:
- Jaw Line
- Tooth Line
- Lip Line
4. Fractal Indicator
resistance indicator (reversal), in the form of an up arrow (green) and a down arrow (red) with period 5.
Signal Entry:
Call / Up, if the red arrow appears below the candle.
Put / Drop, if the green arrow appears above the candle
5. Parabolic SAR indicator
Parabolic SAR works based on the price chart and is reflected in the form of small dots. The aim is almost the same as the average shear, but parabolic SAR moves with a large acceleration and can change its location to price.
The workings of the Parabolic SAR indicator are:
- CALL / UP if the parabolic SAR point appears below the candle
- PUT / DOWN if the parabolic SAR point appears above the candle
6. Awesome Oscilator Indicator
trend designation indicator with a bar chart in green (price goes up) and red (price drops).
If the movement of the stem is below the period line and forms a bowl, it indicates a downward trend, if the movement of the stem above the cup-shaped period line reverses indicates the trend is rising.
Signal Entry:
- Call / Rise, if the green stem moves from the period line and will form an inverted bowl. Or Green Rods grow longer and higher.
- Put / Down, if the red stem moves from the period line and will form a bowl or the red stem grows longer down
7. Indicator RSI (Relative Strength Index)
It is used to understand the strength of the trend that is occurring and the possible turning point of this trend. RSI compares the absolute size for the growth of asset prices in a certain time period with levels falling in the same time period. The results of calculations are shown in curves with numbers from 0-100%


No comments